I was deliberately ignoring the dyno numbers, and just going on the interpretation of the graph, since dyno numbers vary so much.
But yeah, I hear ya, in theory that's one thing is should really be able to tell - where peak power is.
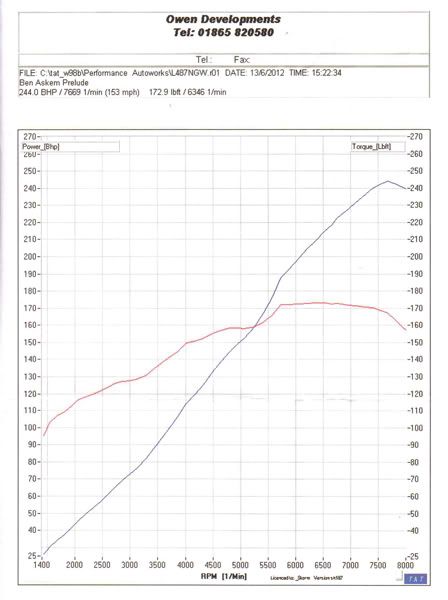
It must just be the dyno. I looked over some of the old dyno results on PUK and most get peak power around 7.2K -7.3K. Although my last dyno of my H22a8 5th gen (on a Dastek) gave peak power at 7.6K but the previous dyno on a Maha was 7.1K.
EdThe209thOfHisName wrote:, I kinda knew you were considering a more complex understanding (and had obviously read the sheet in its entirety)...seems I'm all about the cheap shots
I thought it was best to run in the closest ratio to 1:1, which is generally 4th? 5th would only be right for that if your final drive was meaning all gears were geared down???
There's a great post somewhere from Rich about why they do it wurly, but in essence 4th is the nearest to 1:1 so gives the least resistance and generally gives higher numbers, but doesn't really reflect the real world.
By mapping the car 'under load' instead, the numbers may not be as high, but it's a truer reflection of the conditions the engine will be working under.
That's all in my very limited (regurgitated) understanding!!